MS MarlinSpike Passive OT/ICS Topology Workbench
GrassMarlin, modernized · Open-source · v3.5.0

Passive OT/ICS topology workbench

Feed it pcap or pcapng, keep packet transmission at zero, and review topology, asset context, cross-Purdue paths, suspicious external comms, and portable JSON reports — with the team.

Collection
Passive
Zero transmission
Deployment
Docker first
1 core / 1 GB RAM
Artifact
Portable JSON
Engine ↔ workbench contract
Operator fit
Team workbench
Multi-user, shared URL
Latest release · v3.5.0

Map-first workbench, multi-lens relational graphing.

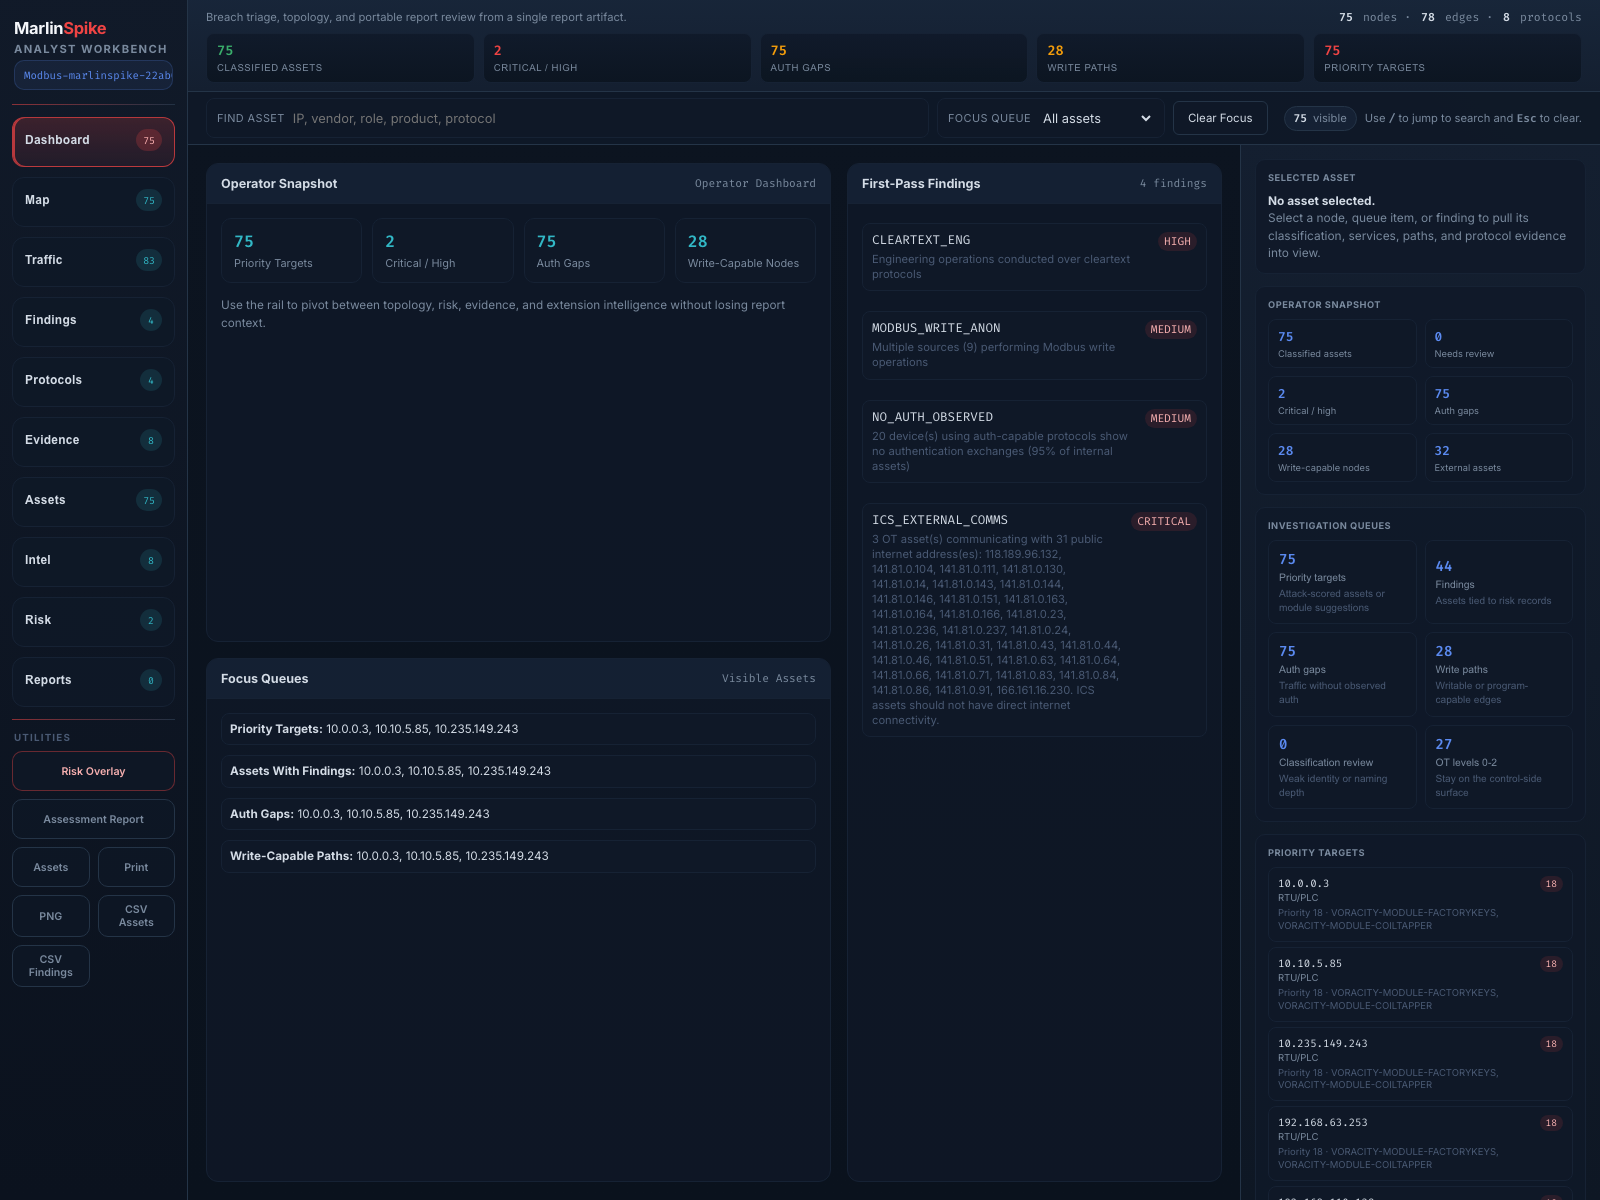
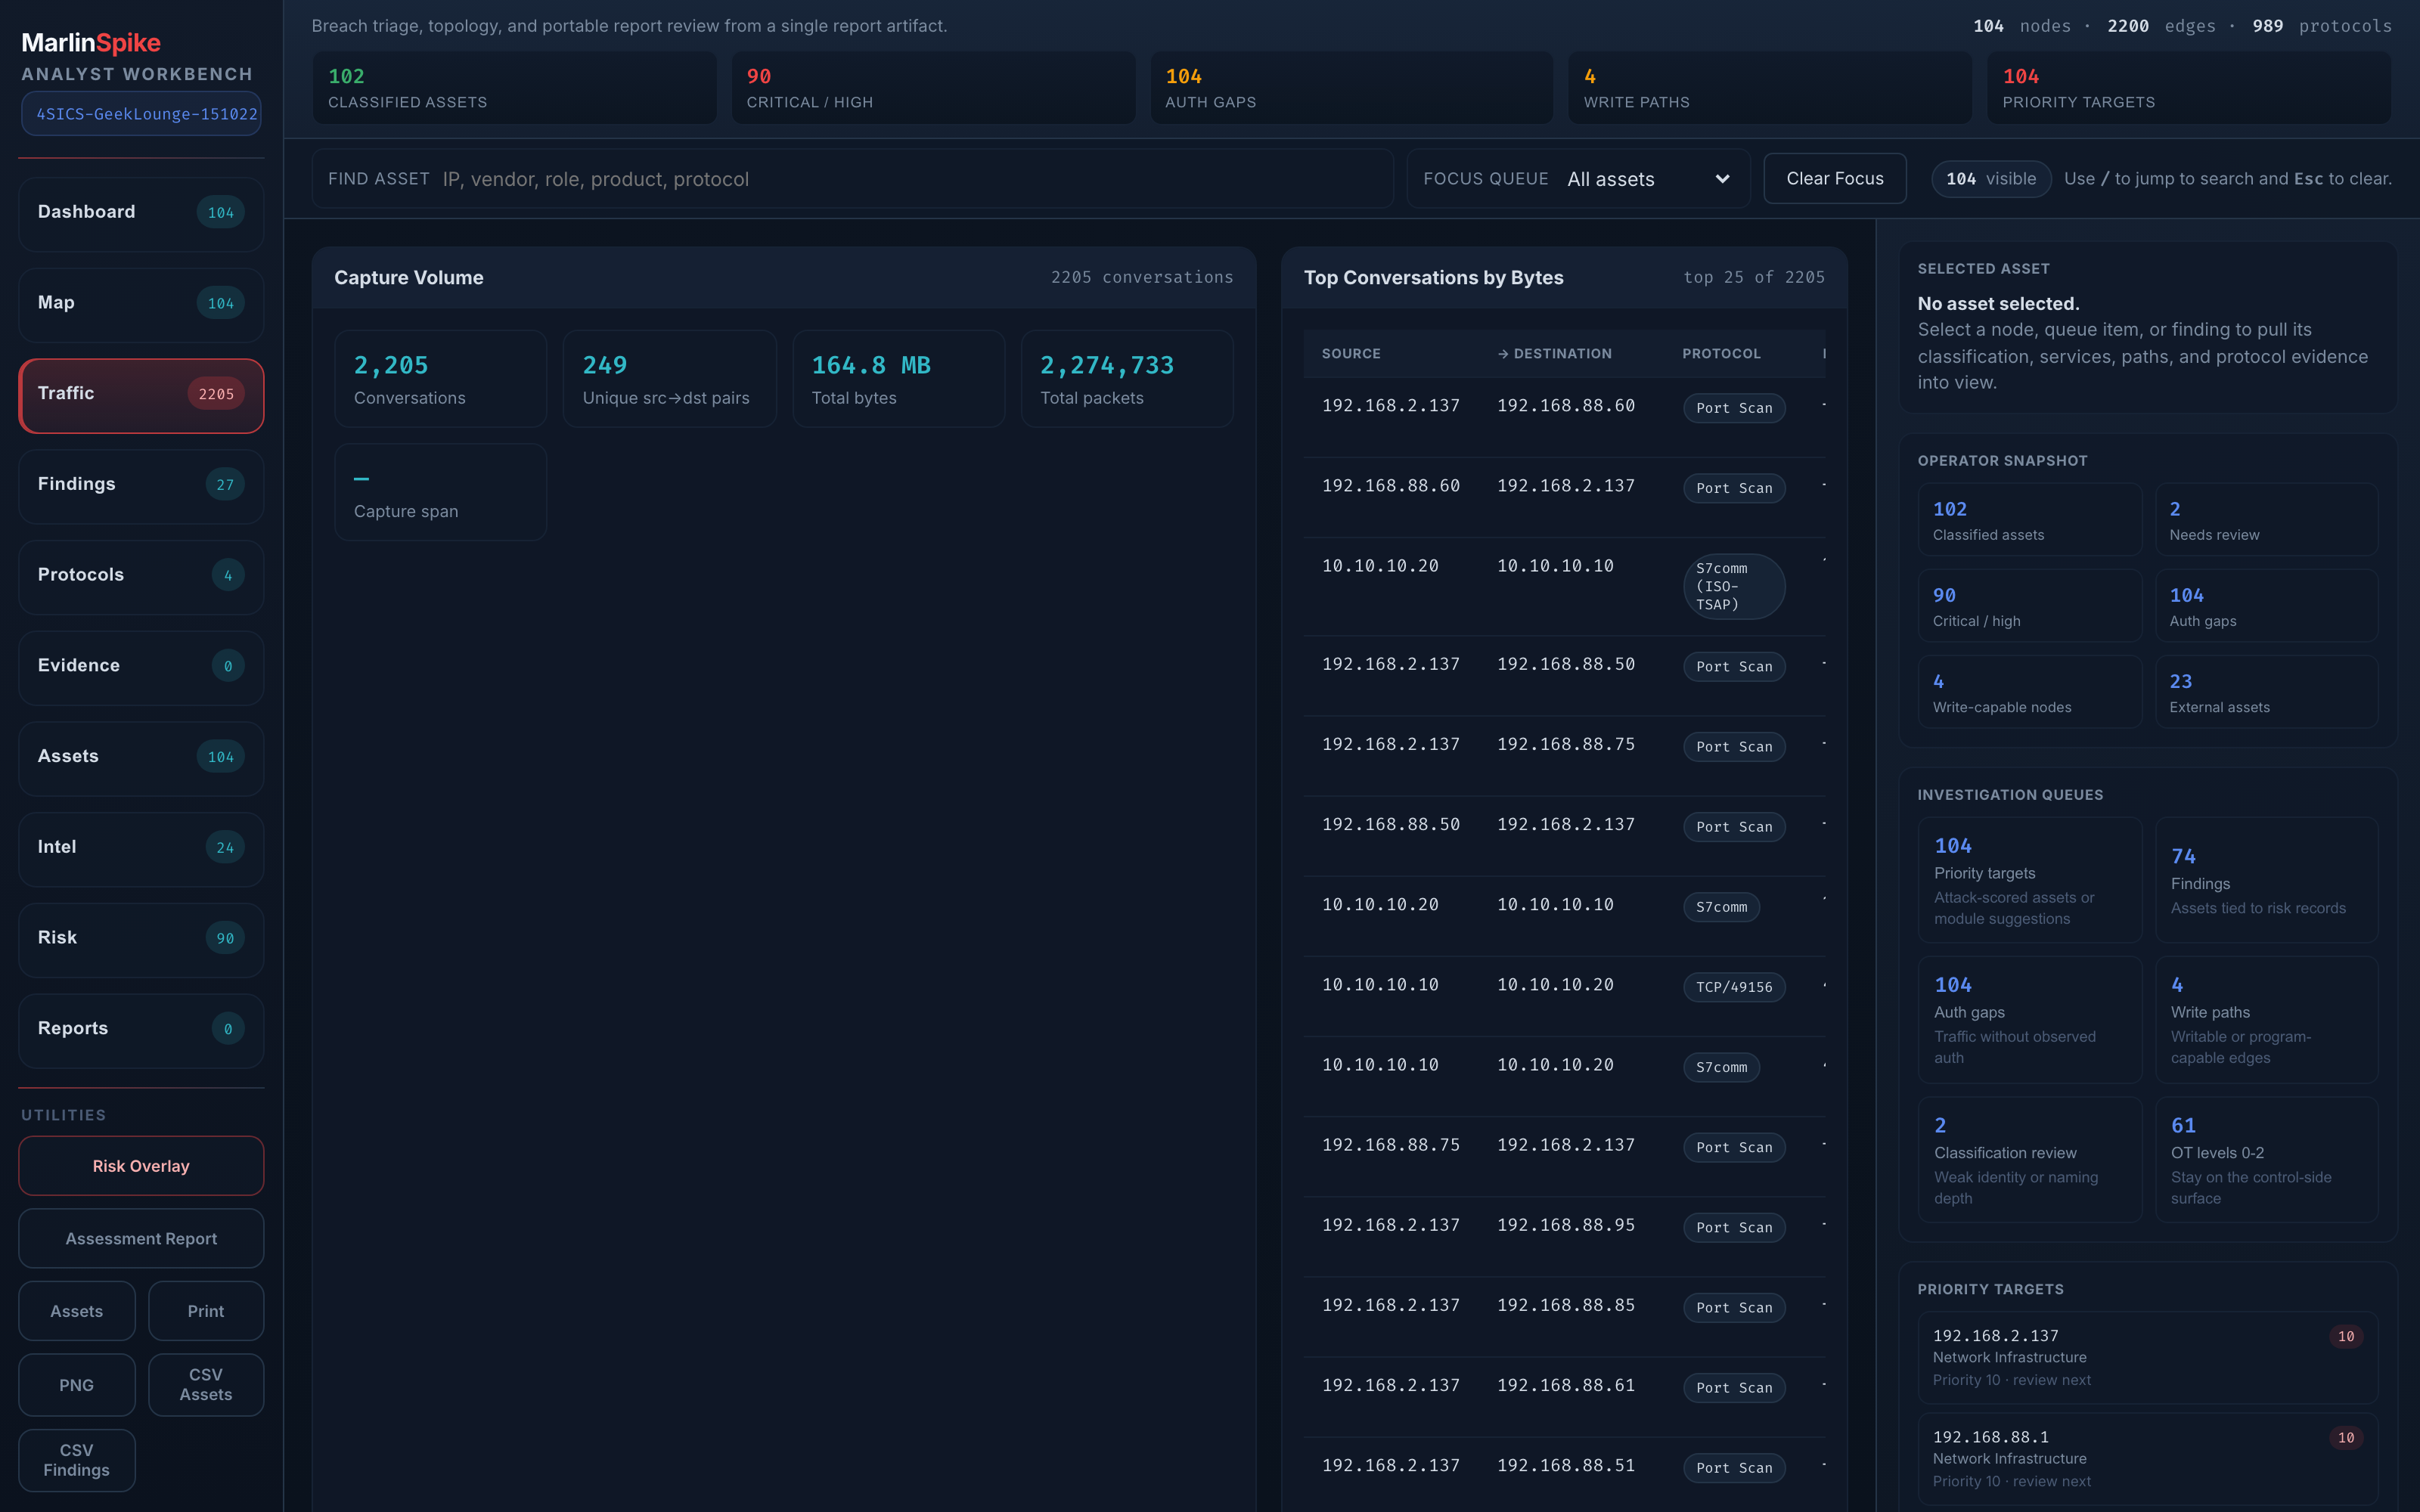
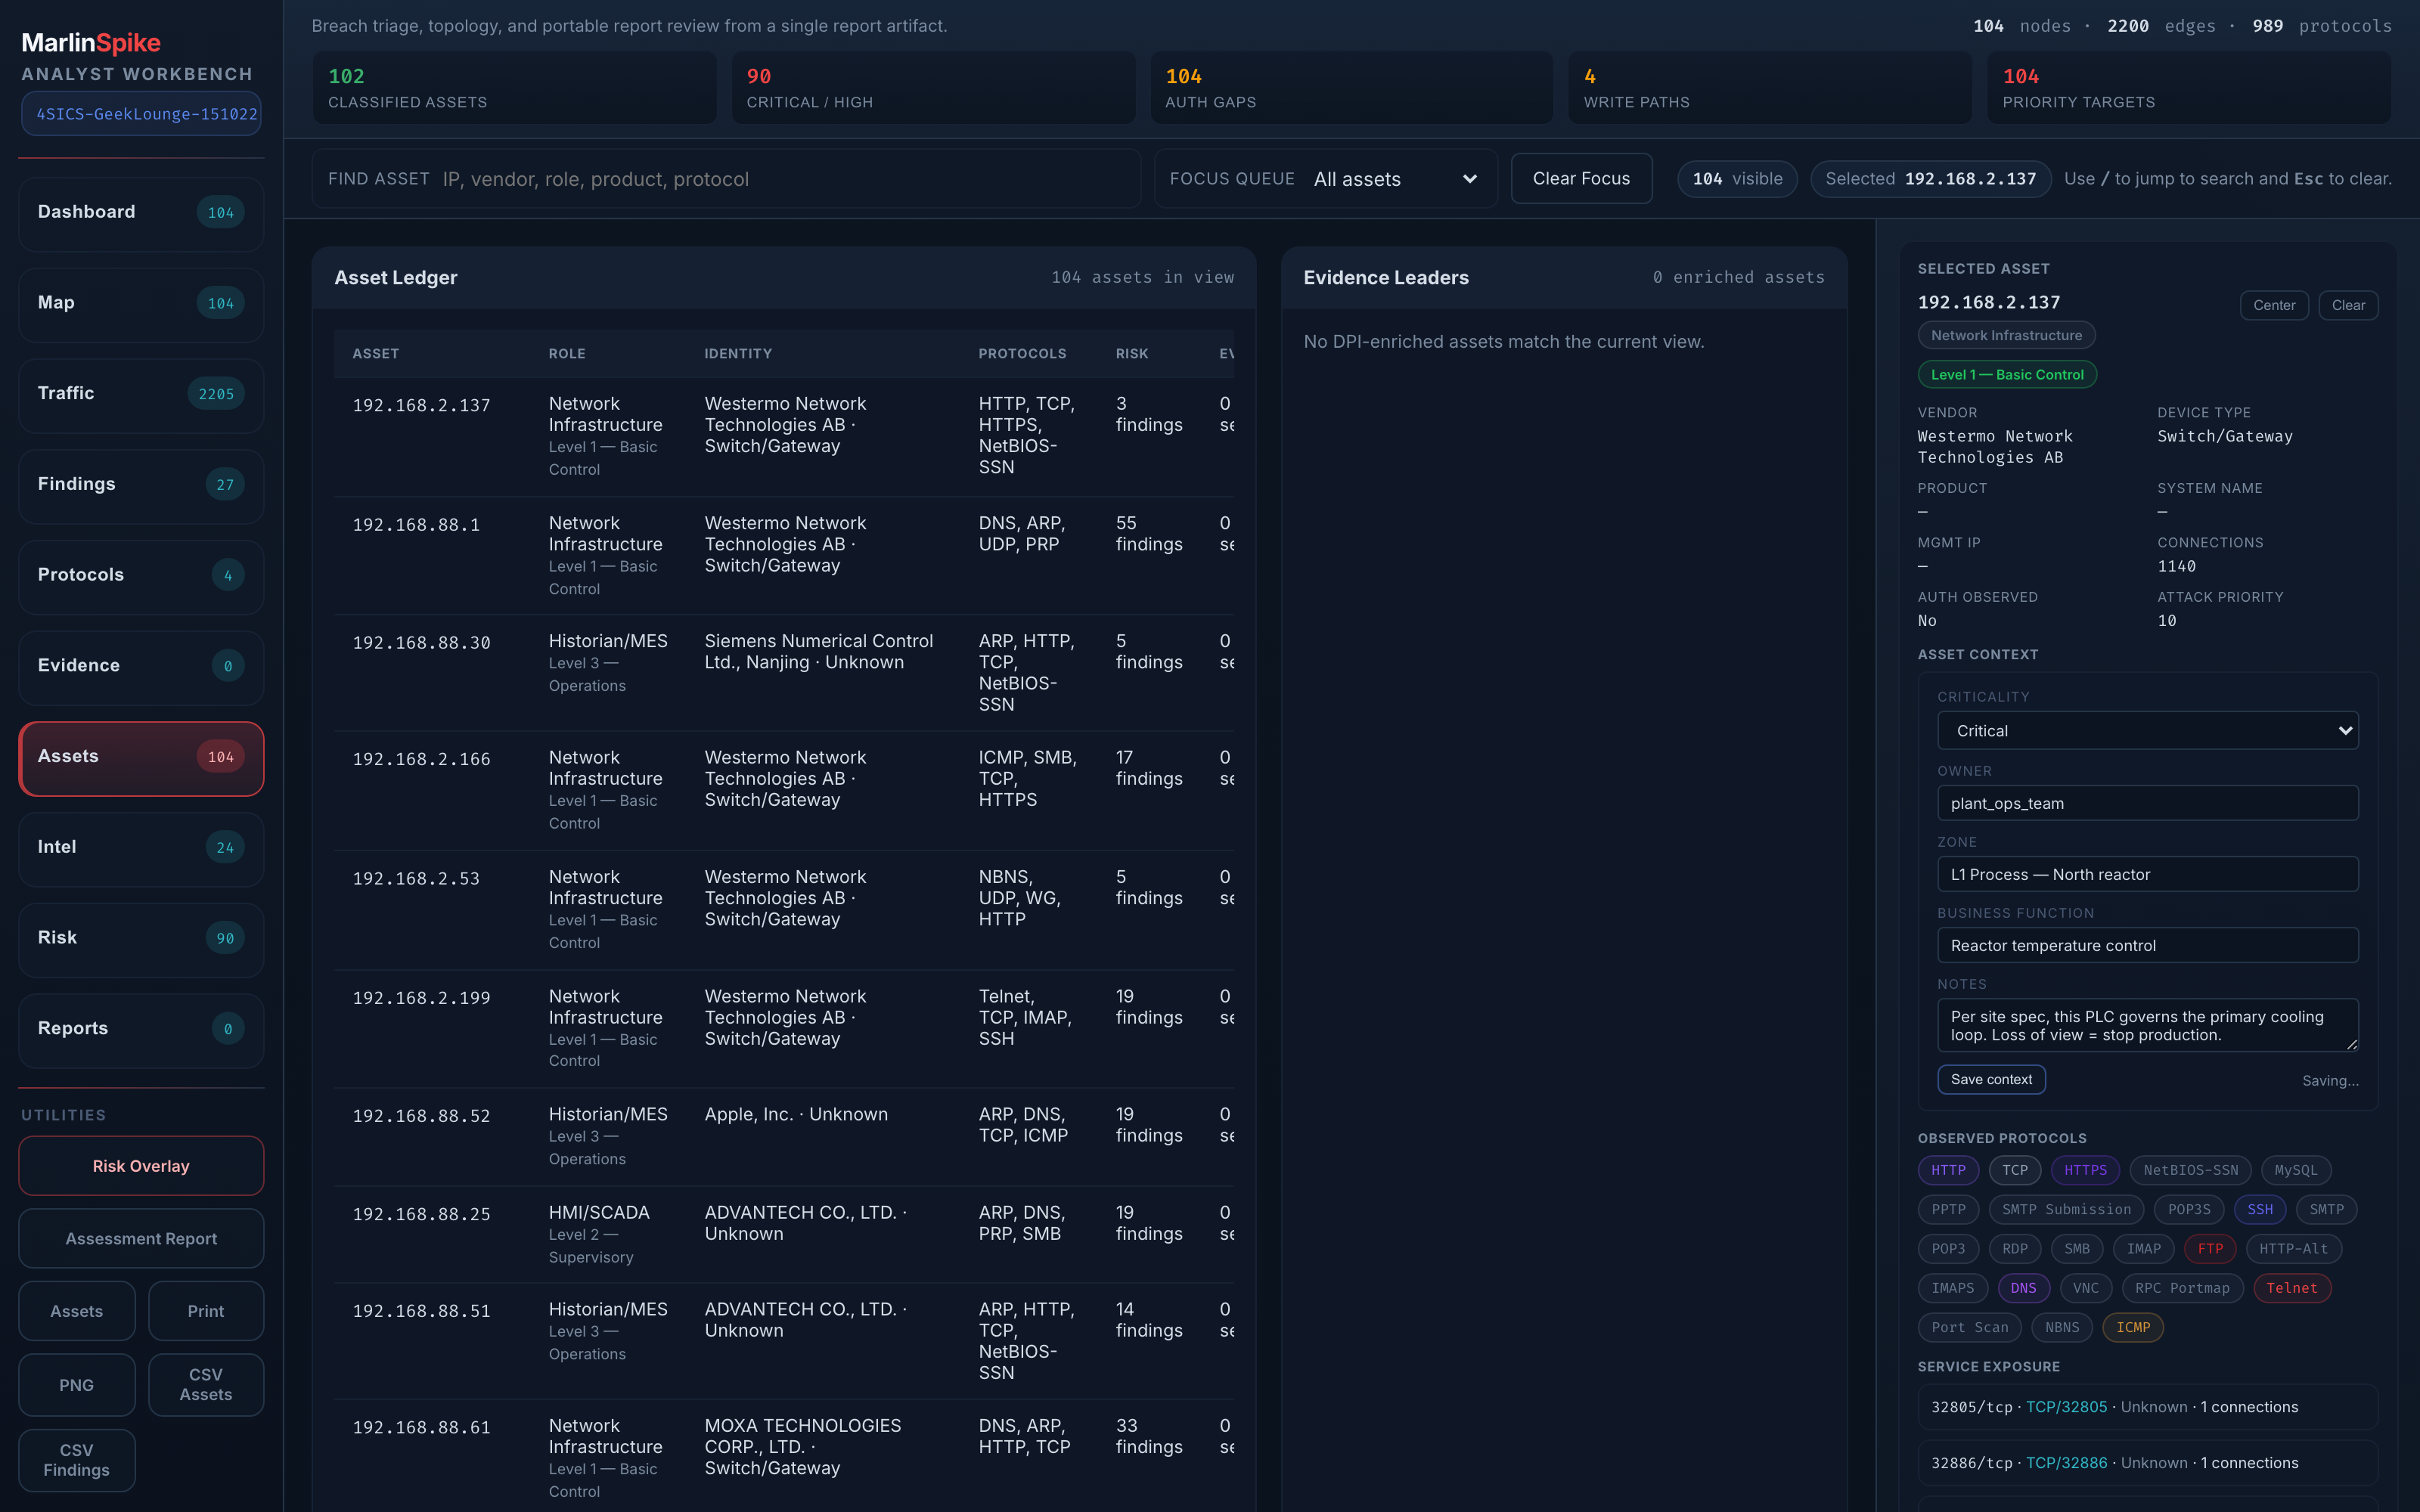
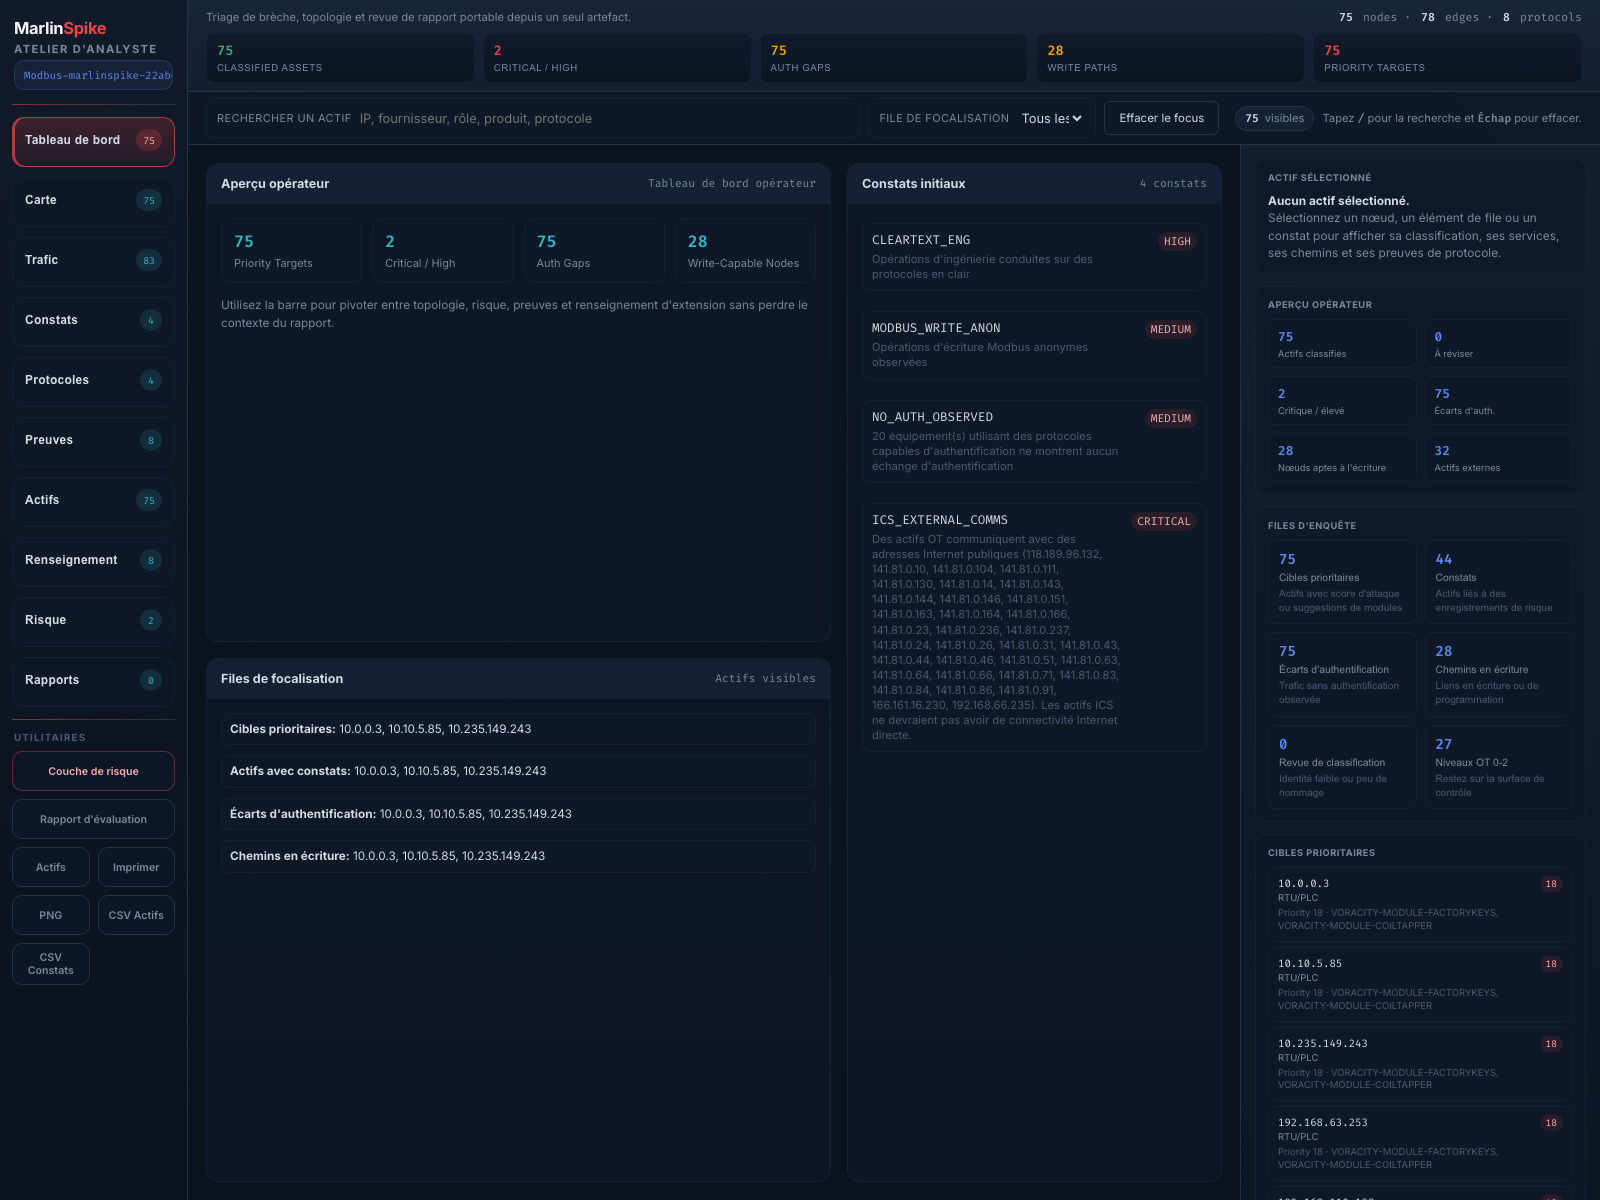
A persistent map canvas with a lens chip strip on top, a dockable inspector on the right, and a slide-up drawer with seven tabbed tables at the bottom. Six lenses re-render the map: Comms, Findings, IOC, ATT&CK, Baseline, and Peers — all derived from a single 12-entity / 12-relationship taxonomy.

HP-HMI modeSub-PCAP carve-outAsset contextIOC threat-huntATT&CK matrixEN / FR
MarlinSpike map-first workbench
Design principles

What MarlinSpike commits to.

Six non-negotiable principles derived from the realities of passive OT/ICS analysis on real engagement hosts. They shape every release.

01

Passive Analysis Only

MarlinSpike ingests packet captures and sends nothing back into the environment. Zero transmission is the baseline, not a configuration option.
PRINCIPLE.01.2026
02

OT-Native, Not Adapted

Built ground-up for OT/ICS — Modbus, S7, DNP3, IEC 60870-5-104, CIP, MMS, GOOSE, BACnet, OPC UA, PROFINET. Purdue inference and vendor fingerprinting are first-class.
PRINCIPLE.02.2026
03

Shared Workbench, Not Single-User

Projects, scans, asset context, IOC lists, and findings travel with the team. Designed for engagements where four people open the same URL.
PRINCIPLE.03.2026
04

The Report Is the Contract

Every analysis emits a portable JSON report artifact. Engine and workbench are decoupled across that boundary so reports survive the tool that produced them.
PRINCIPLE.04.2026
05

Field-Deployable Footprint

Reverse-proxied Docker Compose, 1 core / 1 GB RAM minimum, runs on a temporary engagement host. No client-side JS required for the core triage flow.
PRINCIPLE.05.2026
06

Bilingual by Default

Every screen — including engine-emitted finding categories, descriptions, and remediations — flips between English and Français. Locale picker in the nav, session-persisted.
PRINCIPLE.06.2026
What teams actually do with it

Three jobs MarlinSpike was built for.

Topology reconstruction, responder triage, and longitudinal asset baselines — in one shared workbench, fed by passive captures.

Topology reconstruction

Captures in, graph out. Purdue-level inference, vendor fingerprinting, role hints, cross-zone path discovery, and write-capable path enumeration — all from passive traffic.

Responder triage

Findings ranked by contextual severity, ATT&CK overlay (ICS + Enterprise), IOC threat-hunt across every report in a project, anomaly histograms for beaconing / DNS entropy / unsecured OPC.

Longitudinal baselines

Per-asset novelty cards, project-level baseline diff between captures, dedupe across MAC-keyed and IP-fallback identities. Drift surfaces before someone has to remember it.

The key understanding

MarlinSpike isn't a desktop analyzer. It's a temporary on-site workbench for OT engagements — drop it on an engagement host, share the URL, triage together, hand off the JSON report.

The responder loop, closed

Four surfaces that turn "the workbench found something" into something you can act on.

The v3.x line is built around closing the gap between analysis and action. Every release adds another link in the spotted-it→opened-it loop.

Time scrubbing + sub-PCAP carve-out

The analyst loop's most expensive step used to be re-cutting captures by hand. The capture timeline + Extract column collapse it into a single workbench gesture.
  • Adaptive packet-rate histogram below the workbench toolbar
  • Drag a time window — every conversation pane filters live to that range
  • Per-row Extract button shells out to tshark + editcap, downloads pcap
  • From "spotted it" to "open it in Wireshark" is two clicks
Traffic Statistics pane with the adaptive packet-rate histogram and per-row Extract column

Asset context with contextual severity

Severity is meaningless without context. Asset context bumps findings up a tier when an affected asset is tagged critical and drops one tier when all affected assets are tagged low.
  • Tag every asset with owner, criticality, zone, business function, free-text notes
  • Project-scoped, MAC-first / IP-fallback key
  • MEDIUM on a safety controller can outrank CRITICAL on a print server
  • Per-finding notes (status + body) travel with the project across reports
Asset context editor showing criticality, owner, zone, business function, and notes

IOC threat-hunting across every report

The 
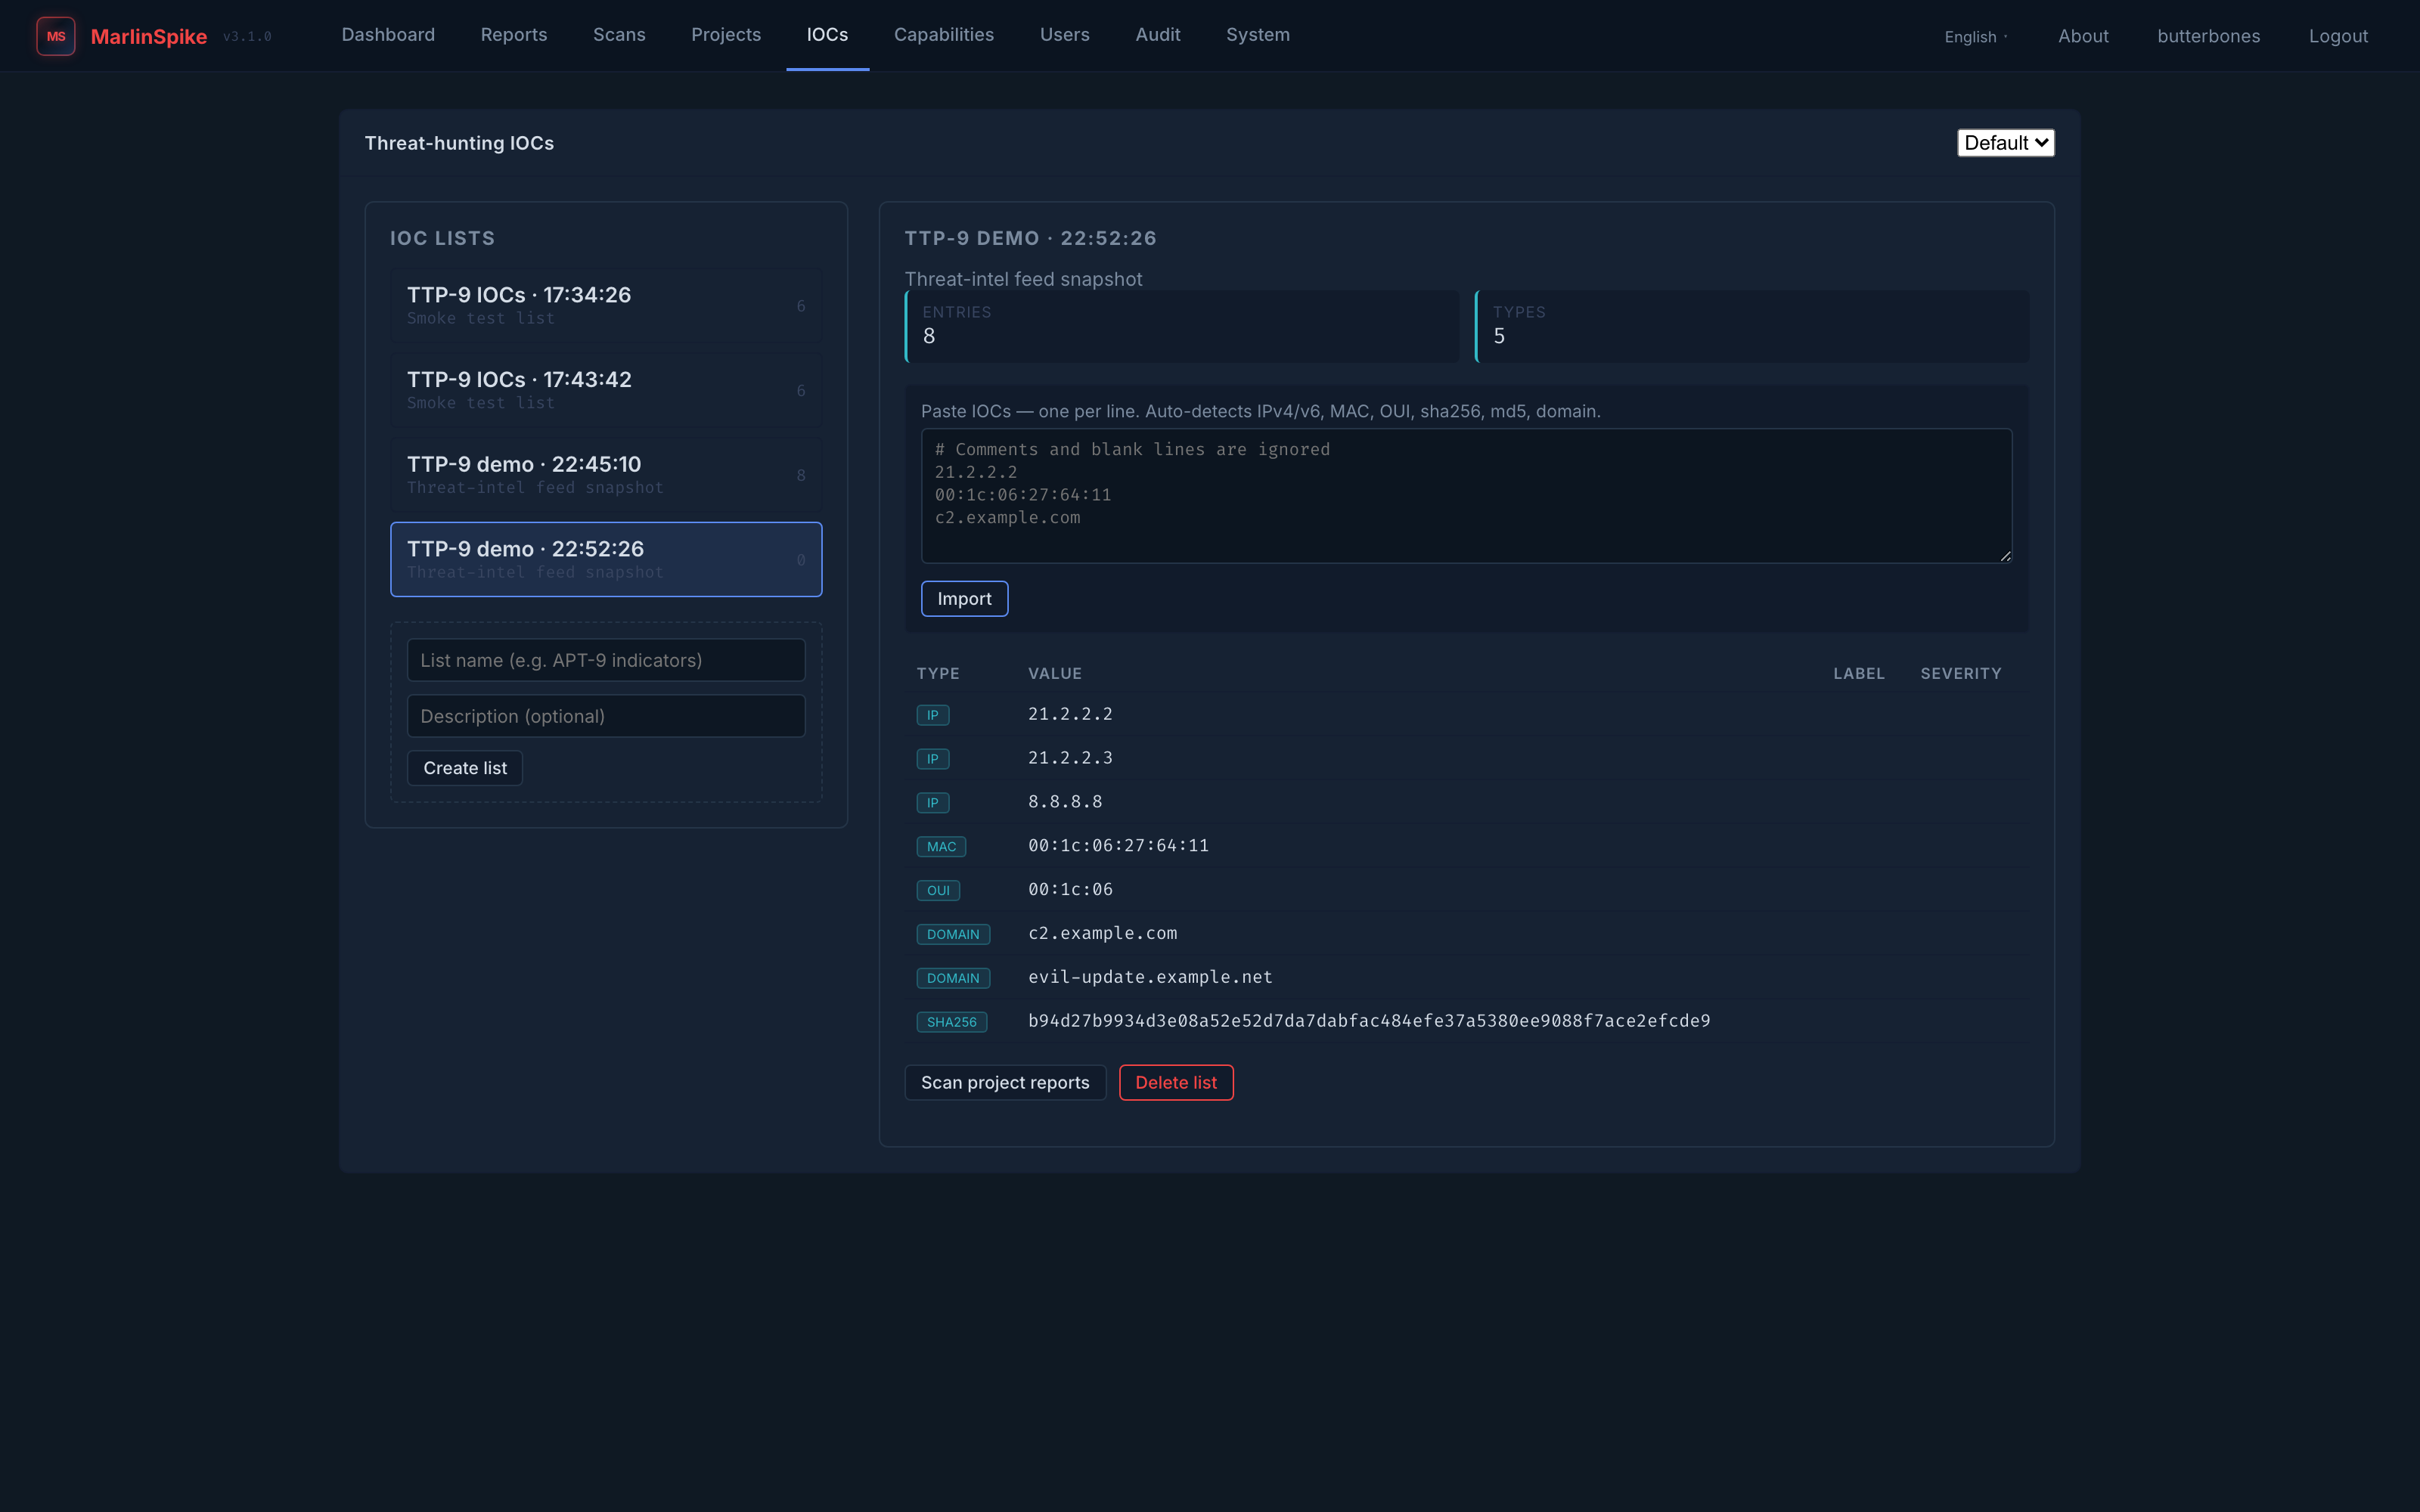
/iocs page is a paste-and-scan workflow. STIX / MISP import is on the roadmap; the paste-list MVP is live.
  • Paste-bulk import auto-detects IPv4/v6, MAC, OUI, sha256, md5, domains
  • Scan project reports walks every report — nodes, conversations, c2, DNS, malware findings
  • Per-IOC severity rollups and per-report match locations
  • Project-scoped lists, persistent across runs
IOC management page with paste-bulk import and per-report match table

Live ATT&CK matrix from passive observations

The ATT&CK lens is a direct projection of the engine's own classifications, not a marketing overlay. If the engine emitted T1040, the lens shows T1040.
  • Tactic-grouped technique grid (ICS + Enterprise domains)
  • Sourced from the marlinspike-mitre plugin output, not hand-curated
  • Sub-techniques, mitigations, and response guidance per finding
  • Click any technique → pivot to the findings that triggered it
EN · FR · ··· coming

Bilingual workbench, more languages coming

Bilingual EN / FR ships today across every workbench surface. The i18n architecture is built so additional locales are a content drop, not an engineering project.
  • Every screen flips between English and Français — including engine-emitted finding categories, descriptions, and remediations
  • Locale picker in the nav, session-persisted, with Accept-Language fallback
  • Homegrown JSON-dictionary i18n layer — no new pip dependencies
  • Additional locales planned; the dictionary structure makes new languages additive, not a refactor
MarlinSpike workbench rendered in French — Tableau de bord opérateur
Who it's for

Built for the people who actually triage.

MarlinSpike is the open-source core behind Fathom. It exists to be useful to working OT/ICS responders, not just systems programmers.

To responders

Drop it on the engagement host, give the team a shared URL, work the same project together. The report artifact survives the host.

To OT engineers

Passive only. No active scans, no agents, no plant-floor risk. Read-only mounts of rotated captures. HP-HMI mode for the wall display in the control room.

To integrators

pip install marlinspike exposes create_app and db. Three formal extension surfaces: Rust engines, Python plugins, YAML rule packs.
The path forward

Start with the wiki, ship a Docker stack, share a URL.

No license dance, no vendor onboarding call. Five minutes from git clone to a working workbench at 127.0.0.1:5001.